Winning the Day: How Focusing on 24 Hours Transforms Agile Teams and Big Goals
In our fast-paced SAFe environment, we’re often laser-focused on those big PI Objectives and long-term enterprise goals. But here’s a game-changer: true agility comes from winning the day. By prioritizing today’s collaboration, delivery metrics, and team maturity, we build unstoppable momentum—tomorrow will sort itself out.
This mindset is key when navigating tricky dynamics, like a Product Manager nitpicking in PI Planning or getting defensive in retros. Instead of fretting over future impacts, coach in the moment: foster psychological safety with constructive feedback, like “What might that comment mean for team trust today? How can we adjust right now?”
As Jesus teaches in Matthew 6:34 (TPT): “Refuse to worry about tomorrow, but deal with each challenge that comes your way, one day at a time. Tomorrow will take care of itself." Let’s apply this in our ART—own the 24 hours, elevate our CoP, and drive real transformation without overstepping.
Quick Win-the-Day Checklist for Coaches:
-
Assess Now: Pulse-check collaboration in today’s standup or retro.
-
**Act Diplomatically: **Use a script like: “I noticed [behavior]; how’s that landing? What small shift wins us today?”
-
Reflect & Align: End with one actionable item tied to compliance and value delivery.
-
Celebrate: Note a maturity win to share in the CoP.
What’s your daily win?

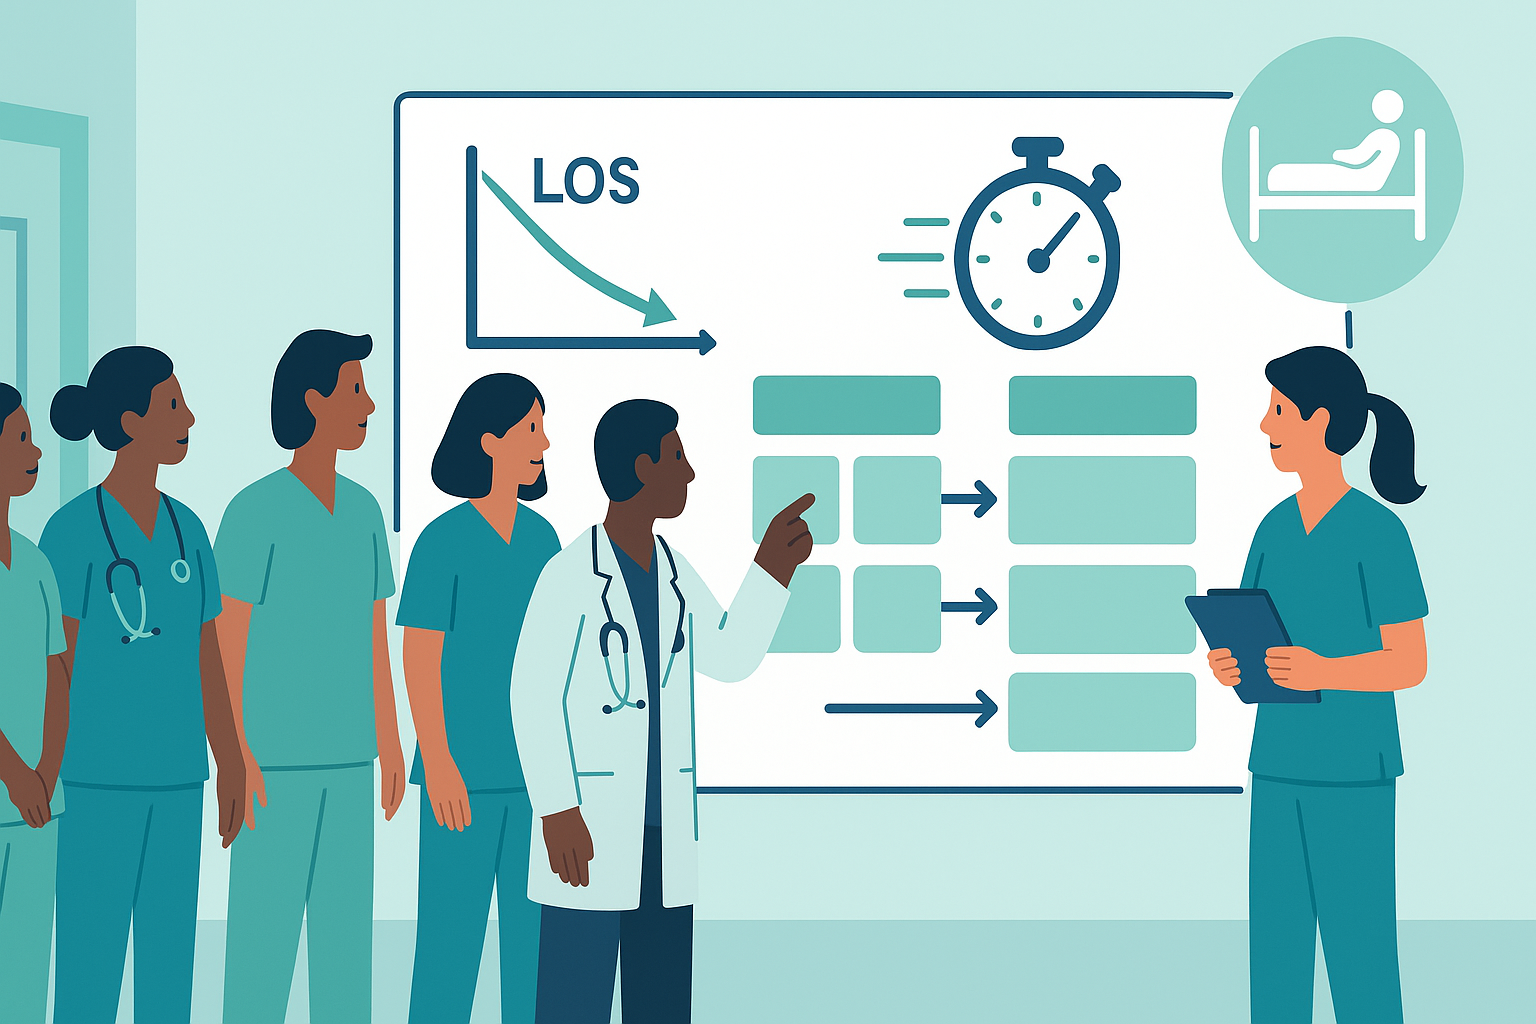
How Nurses Cut Hospital Stays for People with Frailty (and what Agile teams can learn)
A five-nurse specialist team redesigned care for frail patients, slashing average hospital stay from ~18 days to ~2.4 days in six months. This is an ~86% reduction while improving experience and saving millions!
Here’s my Agile angle (real-world moves you can borrow):
-
Treat assessment like fast triage: front-load expertise early to prevent long tail delays (NHS guidance ties early frailty teams to shorter LOS).
-
Make a “same-day flow” lane: prioritize small, testable steps that discharge or decisively progress work within 24–48 hours (Frailty SDEC models show impact).
-
Measure stability, not busyness: track time-to-first-decision and aging work; spotlight blockers daily.
-
Run tiny service experiments: one hypothesis at a time (e.g., earlier specialist review) and keep what reduces average length of stay.
Coaching Moment: What’s our “early specialist” move that, if done within the first day, would prevent most downstream delays?
The Last Almanac, The Lasting Leason
Sad News: The Farmer’s Almanac is printing its last edition after 200 years. This reminds us to build systems that learn, not just last.
The Farmers’ Almanac was one of the earliest “agile” tools—cadence and anticipation in paper form. Planting charts, moon phases, and long-range forecasts taught generations to plan in rhythms, read signals, and adapt when the weather changed.
That’s our work, too:
- Cadence (PI/Sprint)
- Anticipation (roadmaps, capacity)
- Adaptation (inspect & adapt).
The Almanac’s wisdom: prepare before the season turns, then adjust as reality arrives.

Predictability Before Velocity
Predictability isn’t about control—it’s about clarity. Before we chase faster, we need steadier. I look at three things every week:
1. Stability: % of planned scope actually delivered (keep it simple, team-level).
2. Flow health: aging WIP and average WIP vs. a sensible limit.
3. Surprises: unplanned work as a % of total.
If stability is jittery, velocity won’t save you—it’ll just hide the wobble. Start small: cap team WIP for one sprint, slice anything > 3 days of effort, and time-box a 15-min “assumption burn-down” review. Stability first. Speed later.
Want my Excel template and my one-slide PowerPoint exec view for free? Download them here

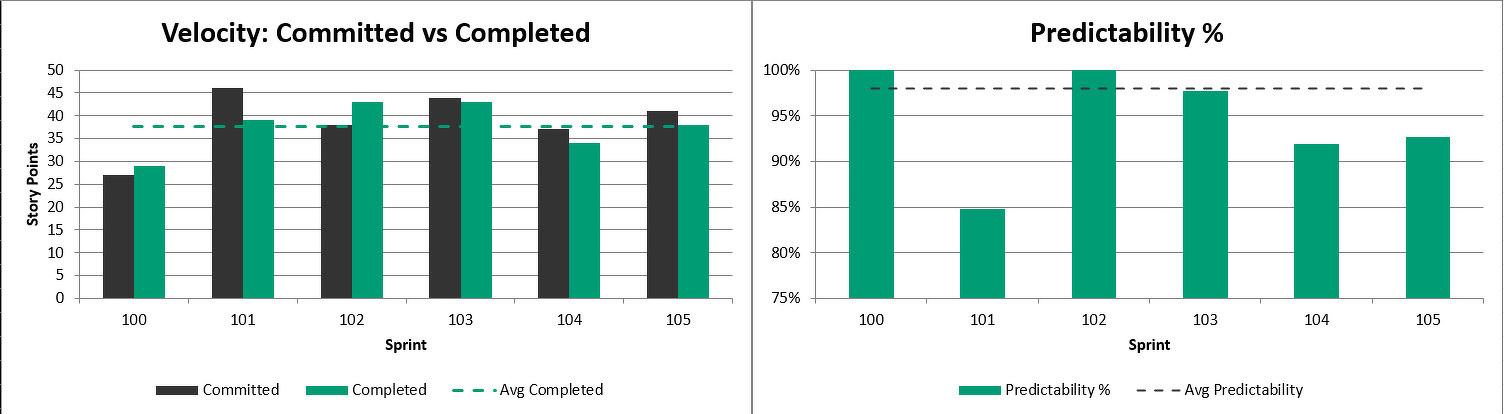
Make Delivery Predictable (For Real)
For years I’ve sat in sprint reviews where the numbers didn’t match the story. Stakeholders wanted predictability; teams wanted space to improve. Our project tracking reporting system is abysmal with only paid for customizations. That’s why I built this Sprint Metrics Dashboard after too many “Why wasn’t this predictable?” conversations. It’s the setup I use with real teams to keep data honest and the story clear:
Here’s how I use it with real teams:
Velocity: committed vs. completed with a clean average line so scope creep isn’t hiding in the bars.
Predictability: easy-to-read bars per sprint + an average line (chart capped at 100% so we don’t distort).
Quality: defects open vs. closed with a steady Team Health reference so we don’t chase numbers at the expense of people.
My workflow each sprint:
- Update the last 6 sprints on Sprint Data (dates, committed, completed, defects, team health).
- Scan Predictability for drift. Ask: “What changed?”
- Use Notes to capture 1–2 retro prompts tied to the charts.
- Share a one-slide snapshot so leadership hears the same story the team is living.
If you’re a Scrum Master or Project Leader who wants fewer debates and more decisions, give my Sprint Metrics Dashboard a try:
👉 Download (free): Sprint Metrics Dashboard
✨ I am also working on an enhanced Dashboard to incorporate more metrics. Get early access here: Enhanced Sprint Metrics Dashboard
#scrum #agile #metrics #delivery #projectmanagement #scrummaster